 Blogs
Blogs
See Crashlytics issue reports directly in Android Studio with App Quality Insights
Android developers all across the world rely on Firebase Crashlytics to surface detailed insights and context into the events leading to a crash. Crashlytics gives you a complete view into your app’s stability — helping you track, prioritize, and fix critical issues before they impact a large number of users.
However, even with detailed and real-time crash reports, troubleshooting usually requires you to jump between the Crashlytics console and your codebase to locate the error. Looking at stack traces in a browser and then having to navigate through your source code to find the right place to set your breakpoints is mentally taxing and can be frustrating. And it’s easy to miss new reports if you’re not regularly checking the Firebase Console.
That’s why Android Studio Electric Eel introduces the new App Quality Insights window, which helps you discover, investigate, and reproduce issues reported by Crashlytics all in one place and within the context of your local Android Studio project.
Getting started
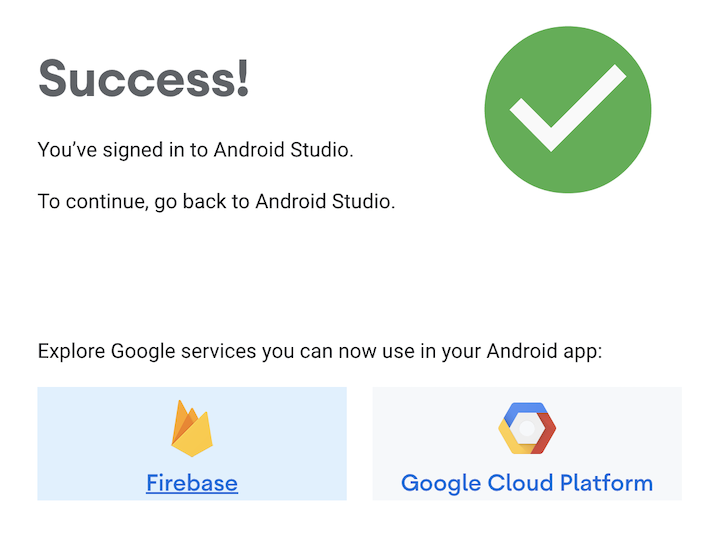
If you’re already using Crashlytics in your app project, getting started with App Quality Insights only requires a few clicks. All you have to do is make sure you’re logging into Android Studio with the same Google Developer account you use to access Firebase Crashlytics for this project. To log in, open the App Quality Insights window by navigating to View -> Tool Windows -> App Quality Insights , click the Log in link, and follow the prompts.
If you’re not using Crashlytics in your project yet, you can do so by following these instructions.
Crashlytics is set up! Now let’s see the error reports
Once you’re logged in, navigate to the App Quality Insights window in Android Studio. The IDE then downloads the latest crash data for your app, sorted by those that occur most frequently.
When you click on a specific issue, detailed information is shown including the sample stack trace, affected devices, and affected Android versions.
1: Show details about the latest occurrence of the event you click. You can see the event’s stack trace and click on the stack trace to jump to the relevant lines in your code base.
2: Break down the crash counts by device type.
3: Break down the crash counts by Android version. Along with the crash counts by device type, you can determine which user groups are most affected.
From crash to code (and back again)
With the App Quality Insights window you can jump from the crash report to the relevant line of code, which resolves the biggest friction when triaging crash reports.
Note: Because the IDE navigates to the exact file and line number indicated in the stack trace, if there have been recent code changes between your current checkout and the version of the app that caused the crash, the IDE might not accurately navigate to the relevant lines of code.
Additionally, if you’re already in the code editor, the gutter on the left shows a crash icon on the relevant lines of code that have the corresponding crash report. Clicking the crash icon opens the detailed report pane, which allows you to jump between the crash reports to the code seamlessly.

Filtering crashes
The following filters help you narrow down the list of crash reports to the ones you care about most.
App ID
If your project includes multiple app modules, make sure the module you want to see issues for is selected from the module dropdown menu.
Severity
Select or deselect the icon to toggle the visibility of the crash reports depending on the severity, fatal ❌ or non-fatal ⚠️.
Recency
To view only reports with crashes that have occurred recently, you can use the dropdown to select the desired timeframe, such as “7 days” or “30 days”. This allows you to see crashes that are relatively new or are currently affecting your users. Setting a different value also updates user and event counts across the tool to reflect the selected timeframe.
App version
Finally, if you’ve recently launched a new version of your app to production, and you only want to see the latest crashes that affect that release, you can use the App version selector to select one or more versions of your app that you want to see crash reports for.
New additions in Android Studio Flamingo
If you use the preview version of Android Studio, you can try the new features added in Android Studio Flamingo (now in Beta) to help you troubleshoot the cause of the crashes more effectively and make it easier to collaborate with your colleagues.
Annotate and close the issues directly from Android Studio
Viewing and editing notes
You can now view and attach notes to issues directly from the IDE. These notes can be viewed by other team members who also have access to the Crashlytics project, so that the progress of an investigation can be shared across the team.
Open/Close the issue from Android Studio
If you’ve uploaded a fix to a tricky issue, let everyone know by closing the issue directly from Android Studio by clicking the Close action! This lets your teammates know that they can focus on fixing other issues.
Keep in mind, when you refresh the App Quality Insights window after closing an issue, those issues are no longer visible in Android Studio and you need to navigate to Crashlytics console to view the closed issues.
If you close an issue by mistake, simply click the action to Undo close.
More filters and filter search
Android Studio Flamingo adds the following additional filters to narrow down the crash reports at a more granular level.
Signals
You can filter the issues by Crashlytics signals. Signals are attached to issues that have certain characteristics. For example:
- Early: Issues with a high percentage of events within the first 5 seconds of a user’s session
- Fresh: New issues that appeared in the last 7 days
- Regressed: Issues that have re-occurred and we’ve re-opened
- Repetitive: Issues with events that happened multiple times per user
Device
Investigating issues can sometimes require understanding patterns, such as certain crashes occurring on specific OEMs or device models. Now, you can filter crash reports by one or more OEMs and specific device models.
Operating system version
Similarly, you may want to identify if certain issues are related to a specific platform version. For example, one that has introduced behavior changes your app isn’t properly handling. Now you can filter issues by specific Android platform versions.
In addition, filters with lots of options are now searchable so you can customize your view faster, without scrolling through all the menu options.
Summary
Troubleshooting crash reports is an essential part of the development life cycle, which helps to deliver a better user experience with your app. We can’t wait for you to try the App Quality Insights window and hear what you think about it.
Make sure to also check out the documentation about the App Quality Insights window for the complete list of available features.
As always, if you find any issues or feedback, don’t hesitate to file an issue on our issue tracker.
Happy coding!
Source: Medium


